
Portfolio Performance (Month 12)
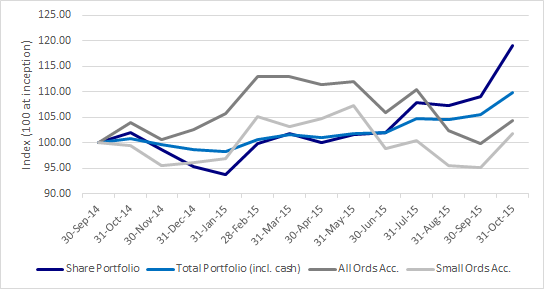
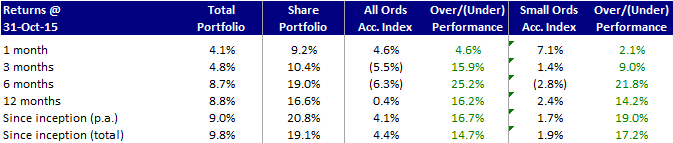
One year in and I’ve already had one period of underperformance and one larger period of outperformance. I was significantly underperforming the two benchmark indices (All Ordinaries Accumulation Index and the Small Ordinaries Accumulation Index) up until early 2015 to the tune of over 10%. I should say upfront that I don’t think that either of the indices are particularly great benchmarks for the likely composition of my portfolio. With my particular style of value investing, I expect to hold a fairly heavy weighting of small to medium cap industrial companies and am unlikely to have much exposure to financial, mining, infrastructure or utility stocks. The top 6 stocks in the All Ordinaries Index are composed of the big four banks, Telstra and BHP and these stocks are huge proportion of the overall index. Given this mismatch, it is clearly not a perfect yardstick for measuring my performance. The Small Ordinaries Index is a bit better by virtue of excluding the 100 largest companies and including the next 200 largest companies, but it is still not that great a measure due to the proliferation of mining and energy stocks. However, I firmly believe that long-only funds should always be measured against some index (compared to long/short funds which should have an absolute return target) and these are two of the most freely available index series that take dividends into account.
When looking at performance numbers it is also important to understand what is included or excluded. The numbers presented above are on the following basis:
- Transaction costs (brokerage) are included
- Dividends are included
- Franking credits are not included
- Taxes are not included
I believe that this treatment is consistent with the methodology of the two accumulation indices that I am using as benchmarks (with the exception of the transaction fees which don’t get factored in for the indices, but which should be included in my performance analysis).
Given the composition of the All Ordinaries Index, it is no surprise that it performed very strongly over late 2014 and early 2015. Sentiment was good and investors in those environments gravitate towards well-known names. The August 2015 market correction had not yet taken place and commodity prices, although clearly on the decline, weren’t nearly as low as they are currently. In contrast, my portfolio over that period of time was on its way down, led almost entirely by poor performance from a basket of mining services and mining-related stocks (I bought them while they were still on the way down) which was partly offset by decent results in the rest of my portfolio.
From early 2015 to the end of October 2015, my portfolio benefited from much better trading results from the mining services and mining-related basket (hopefully they have hit the bottom) as well as a continuation of the good performance of the rest of my portfolio. The banks and commodity players struggled during this time, which significantly impacted the performance of both indices, but in particular the All Ordinaries Accumulation Index. Overall for the first year, I significantly outperformed the benchmarks, with almost all of the outperformance in the second half of this period. Given that it was only a one year period, I wouldn’t read too much into it. I will judge myself over much longer periods of time, but I would be lying if I said that it didn’t feel good to be ahead of the benchmarks after one year.
One other thing that you may notice is that I have presented two sets of numbers for my portfolio. One is solely the portion of my portfolio allocated to stocks, and one is the total portfolio including cash holdings. For various reasons that I will discuss in a later post, I am only about 50% invested in stocks at the moment with the remainder invested in cash. As this is a decision that I have consciously made, I feel that it is important to show the overall returns for the whole portfolio including my cash holdings as these are ultimately the returns that I have to live with. However, I also wanted to measure the performance of my stock portfolio separately as that should be compared to the benchmarks. Over time, I intend to be fully invested at which point I will likely only show the overall portfolio including cash, but until that time comes I will continue to show both sets of numbers.
